Difference between revisions of "Memory Overestimation"
| (7 intermediate revisions by the same user not shown) | |||
| Line 54: | Line 54: | ||
where, once per working day, the memory usage of the nodes was monitored. | where, once per working day, the memory usage of the nodes was monitored. | ||
[[Image:MemDissipation_raw_mem.png| | == Memory overestimation per host == | ||
The figure below illustrates a scatterplot of the memory overestimation (measured once per day since 18 June 2013) for the 130 standard node on HERO | |||
(i.e. the nodes <code>mpcs001</code> through <code>mpcs130</code>). | |||
Ordinate and abscissa refer to the used memory <math>M_u</math> and allocated memory <math>M_a</math>, respectively. Regarding the main plot, the solid diagonal line indicates | |||
the optimal operating mode where <math>M_u=M_a</math>. However, as can be seen from the figure the actual usage is far below that. The bulk of data point suggests that | |||
most of the time <math>M_a=20\ldots24G</math> are allocated per execution host. As can be seen from the inset, the actual memory usage per host is strongly peaked in the region | |||
<math>M_u=8\dots13G</math>. For the region <math>M_a=20\ldots24G</math> this indicates a memory overestimation of approximately <math>8\ldots10G</math>. Further, the dashed | |||
line indicates <math>M_u=0.8 M_a</math>. As can be seen, there seems to be no host (since 18 June 2013) on which significantly more than 80% of its allocated memory are actually used. | |||
[[Image:MemDissipation_raw_mem.png|500px|center]] | |||
< | == Memory overestimation per used slot == | ||
The memory overestimation per used slot (for the same dataset) is shown below. The figure illustrates the | |||
amount of used memory per slot <math>m_u</math> as function of the allocated memory <math>m_a</math> per slot on the standard nodes of HERO. | |||
</ | The inset shows the data for the full range of <math>m_a</math> observed and the main plot shows a zoom in on the | ||
range <math>m_a=0\ldots 5</math> (measured in <math>G</math>). | |||
As evident from the figure, most jobs allocate less than <math>4G</math> per slot and in the range <math>m_a=2\ldots3.5G</math> the approximate | |||
upper bound <math>m_u=m_a-0.7</math> seems fitting. Apparently, the bulk of data seems to be located in the region in between | |||
the lines <math>m_u=m_a-0.7</math> and <math>m_u=m_a-2.1</math> (i.e. the shaded region), indicating that, typically, the required memory | |||
per slot is overestimated by <math>0.7\ldots2.1G</math>. However, be aware that we are illustrating averages per host and per slot, here. For a given host there | |||
might be individual jobs that do much better (i.e. where it holds that <math>m_a-m_u<0.7</math>) that what is shown here. | |||
[[Image:MemDissipation_raw_memPerSlot.png|500px|center]] | |||
== Average memory overestimation == | |||
To summarize the statistics shown above, we might consider the differences between the allocated and used memory. In this regard, the | |||
figure below shows the differences <math>M_a-M_u</math> (top) and <math>m_a-m_u</math> (bottom), averaged for the 130 standard nodes of HERE, over time (since 18 June 2013). | |||
The error bars indicate the respective standard deviation. | |||
From the top figure it can be seen that this average memory difference approximately falls into the range <math>7\ldots 14G</math>. From the figure at the bottom it | |||
is evident that the average memory difference falls within the range <math>1\ldots 2G</math>. These approximate values (stemming from a simple per-day average) are | |||
in good agreement with the above results estimated from the scatter plots. | |||
[[Image:MemDissipation_av.png|500px|center]] | |||
== Long term goal == | |||
Regarding the operation efficiency of HERO and the optimization thereof, it would be desirable to reduce the memory overestimation per used slot, i.e. the quantity <math>m_a-m_u</math> | |||
to a value (permanently) close to or slightly below <math>1G</math> and to reduce the related standard deviation. This would mean that on average, still an overestimation of <math>1G</math> | |||
per slot is accepted. | |||
This can only be achieved, if the users choose <code>h_vmem</code> with care. | |||
Latest revision as of 16:54, 1 August 2013
One of the most important consumable resources that needs to be allocated for a
job is its memory. As pointed out in the
[SGE_Job_Management_(Queueing)_System#Memory|overview], the memory, meaning
physical plus virtual memory, is addressed by the h_vmem option.
The h_vmem attribute refers to the memory per job slot, i.e. it
gets multiplied by the number of slots when submitting a parallel job.
Different types of nodes offer different amounts of total memory for jobs to
run. E.g., a standard node on HERO (overall number: 130) offers 23GB and a big
node on HERO (overall number: 20) offers 46GB.
The operation efficiency of the HPC system, in particuar the workload of the HERO component (following a fill-up allocation rule for the jobs), is directly linked to the allocation of memory for the jobs to be run. For the Cluster to operate as efficient as possible, a proper memory allocation by the users, i.e. as few memory overestimation per job as possible, is inevitable.
Consider the following extreme example: a user specifies the amount of
h_vmem=1.7G for a 12-slot job. I.e., the job
allocates an overall amount of 20.4G. However, upon execution the
job only used an overall amount of approximately 2G. The parallel
environment for this actual example was smp, so the job ran on a
single execution host and the parallel environment memory issue is no issue
here. Albeit this is a rather severe example of memory overestimation (about
18G overall, or, 1.5 per used slot) this job does not
block other jobs from running on that particular execution host, since it uses
the full amount of available slots (i.e. 12 slots).
However, note that there are also other examples that do have an impact on
ohter users: a user specifies the amount of h_vmem=6G for a
single-slot job, which turned out to have a peak memory usage of
36M, only. Due due memory restrictions, four such jobs cannot run
on a single host. However, by means of three such jobs one can block lots of
resources, leaving 5G for the remaining 9 slots. Given the fact
that, here, a typical job uses 2-3G, this allows for only two
further jobs. In this case, the memory dissipation on that host amounts to
17G (in the most optimistic case).
Also, note that the above examples have to be taken with a grain of salt. In general there is a difference betwenn the peak memory usage of a job and its current memory usage. It might very well be that a job proceeds in two parts, (i) a part where it needs only few memory, and, (ii) a part where it requires a lot of memory. However, such a two step scenario seems to occur only rarely.
In particular in late Mai and early June of 2013 there was a phase where the cluster was used exhaustively and where the memory overestimation by the individual users was a severe issue. Consequently, to avoid such situations in the future, it seems to be necessary to point out the benefit of proper memory allocation from time to time.
The two plots below summarize some data that quantify the memory usage for
the 130 standard nodes on HERO. The data was collected since 18 June 2013,
where, once per working day, the memory usage of the nodes was monitored.
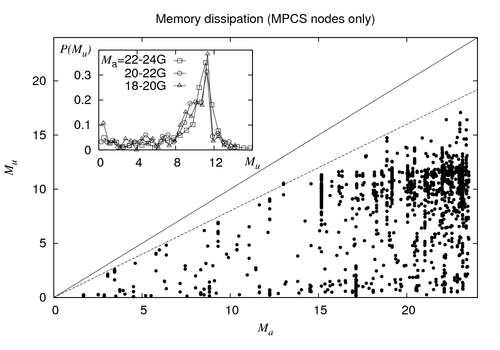
Memory overestimation per host
The figure below illustrates a scatterplot of the memory overestimation (measured once per day since 18 June 2013) for the 130 standard node on HERO
(i.e. the nodes mpcs001 through mpcs130).
Ordinate and abscissa refer to the used memory and allocated memory , respectively. Regarding the main plot, the solid diagonal line indicates
the optimal operating mode where . However, as can be seen from the figure the actual usage is far below that. The bulk of data point suggests that
most of the time are allocated per execution host. As can be seen from the inset, the actual memory usage per host is strongly peaked in the region
. For the region this indicates a memory overestimation of approximately . Further, the dashed
line indicates . As can be seen, there seems to be no host (since 18 June 2013) on which significantly more than 80% of its allocated memory are actually used.
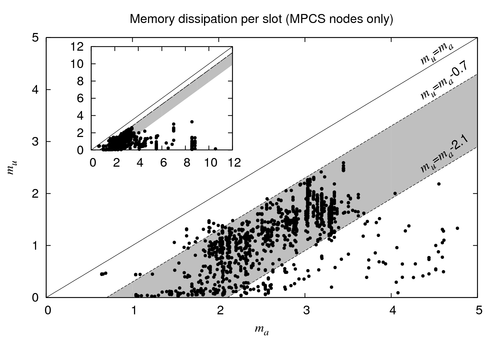
Memory overestimation per used slot
The memory overestimation per used slot (for the same dataset) is shown below. The figure illustrates the amount of used memory per slot as function of the allocated memory per slot on the standard nodes of HERO. The inset shows the data for the full range of observed and the main plot shows a zoom in on the range (measured in ). As evident from the figure, most jobs allocate less than per slot and in the range the approximate upper bound seems fitting. Apparently, the bulk of data seems to be located in the region in between the lines and (i.e. the shaded region), indicating that, typically, the required memory per slot is overestimated by . However, be aware that we are illustrating averages per host and per slot, here. For a given host there might be individual jobs that do much better (i.e. where it holds that ) that what is shown here.
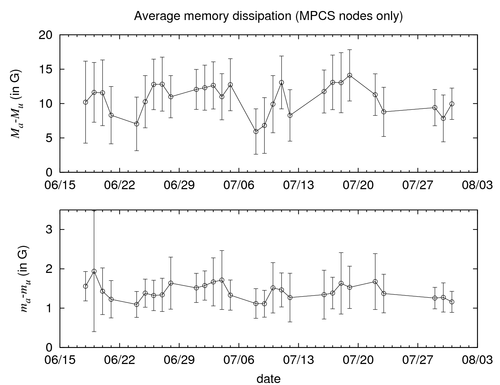
Average memory overestimation
To summarize the statistics shown above, we might consider the differences between the allocated and used memory. In this regard, the figure below shows the differences (top) and (bottom), averaged for the 130 standard nodes of HERE, over time (since 18 June 2013). The error bars indicate the respective standard deviation. From the top figure it can be seen that this average memory difference approximately falls into the range . From the figure at the bottom it is evident that the average memory difference falls within the range . These approximate values (stemming from a simple per-day average) are in good agreement with the above results estimated from the scatter plots.
Long term goal
Regarding the operation efficiency of HERO and the optimization thereof, it would be desirable to reduce the memory overestimation per used slot, i.e. the quantity
to a value (permanently) close to or slightly below and to reduce the related standard deviation. This would mean that on average, still an overestimation of
per slot is accepted.
This can only be achieved, if the users choose h_vmem with care.


